In today’s fast-paced business world, data is the lifeblood of decision-making. Companies of all sizes rely on data to gain insights, make informed choices, and drive growth. This is where business intelligence (BI) tools come into play, and one such tool that has been making waves in the industry is Databox. In this comprehensive review, we will delve into Databox software, its features, benefits, pricing, and even offer you a glimpse of its demo.
Understanding Databox Software
Databox is a cloud-based business intelligence platform designed to help organizations of all sizes turn their data into actionable insights. Launched in 2013, Databox has gained a strong reputation for its user-friendly interface and robust analytics capabilities.
Key Features of Databox
1. Data Integration:
Databox allows you to connect to various data sources such as Google Analytics, Facebook Ads, HubSpot, Salesforce, and more. This ensures that you can centralize all your data in one place, making it easier to analyze and visualize.
2. Data Visualization:
Visualizing data is at the core of Databox’s functionality. It offers a range of customizable dashboards and pre-built templates to help you create stunning visualizations without any coding skills. This is a significant advantage for business users who want to quickly understand their data.
3. Alerts and Notifications:
Databox enables you to set up alerts and notifications based on specific data thresholds. This feature is invaluable for staying on top of critical metrics and responding promptly to any issues or opportunities.
4. Performance Tracking:
You can track key performance indicators (KPIs) and measure the success of your marketing campaigns, sales efforts, or any other business activity. Databox also provides historical data, allowing you to compare performance over time.
5. Mobile App:
The Databox mobile app ensures that you can access your data and dashboards on the go. This is particularly useful for executives and decision-makers who need real-time insights while away from their desks.
6. Collaboration:
Databox offers collaboration features that allow teams to work together on data analysis projects. You can share dashboards with team members and clients, ensuring that everyone is on the same page.
Databox Benefits
Now that we’ve explored some of its features, let’s discuss the benefits that Databox brings to the table:
1. Simplicity:
Databox is known for its user-friendly interface, making it accessible to users with varying levels of technical expertise. You don’t need to be a data scientist to create meaningful visualizations.
2. Real-time Insights:
With Databox, you can monitor your data in real-time, enabling you to make decisions promptly. This is especially critical for businesses operating in dynamic environments.
3. Customization:
The platform offers a high degree of customization. You can tailor your dashboards to display the exact metrics and visualizations you need to track your unique business goals.
4. Cost-effectiveness:
Databox’s pricing model is flexible, allowing businesses to choose a plan that suits their needs and budget. This scalability is beneficial for startups as well as established enterprises.
5. Integration:
Databox’s ability to integrate with various data sources means you can centralize your data effortlessly. This integration enhances data accuracy and saves time spent on manual data collection.
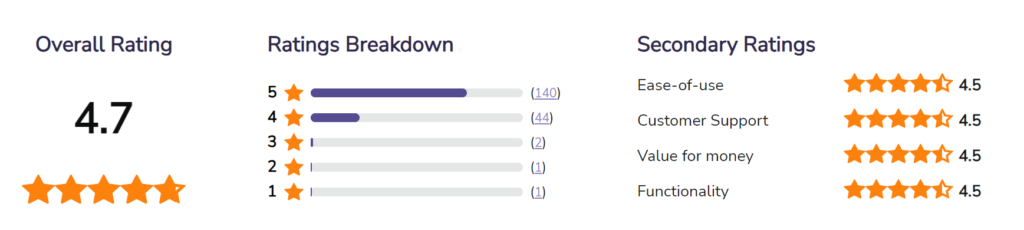
Databox Software Reviews
To provide a comprehensive understanding of Databox, let’s take a look at some reviews from users and experts:
User Reviews
John D., Marketing Manager:
“Databox has transformed the way our marketing team operates. We can now visualize the impact of our campaigns in real-time, and the mobile app keeps us informed even when we’re out of the office. The pre-built templates are a huge time-saver!”
Sarah L., Sales Director:
“I love Databox’s notification feature. It alerts me whenever our sales team hits a monthly target, ensuring I can celebrate their successes in real-time. It’s a great morale booster!”
Michael S., Data Analyst:
“Databox has simplified my job tremendously. I can connect to multiple data sources, create customized dashboards, and provide our leadership with insights they can act on. Plus, it’s a breeze to use.”
Expert Reviews
TechCrunch:
“Databox’s strength lies in its simplicity and user-friendliness. It’s a BI tool that empowers businesses of all sizes to harness the power of their data without the need for extensive training or technical expertise.”
Forrester Research:
“Databox stands out for its real-time capabilities and robust visualization options. It’s an excellent choice for companies seeking agility in their decision-making processes.”
Gartner:
“Databox’s integration capabilities and cost-effectiveness make it a compelling option for businesses looking to extract value from their data. Its mobile app and collaboration features are noteworthy.”
Databox Software Demo
Seeing is believing. Let’s explore a brief demo of Databox to get a sense of how it works:
Step 1: Dashboard Creation
Upon logging into Databox, you’re greeted with a clean dashboard creation interface. You can choose from various templates or start from scratch.
Step 2: Data Source Integration
Databox makes it easy to connect to your data sources. For this demo, let’s connect to Google Analytics.
Step 3: Widget Selection
You can add widgets to your dashboard to display specific metrics. Widgets can be charts, tables, or even text blocks. For our demo, let’s add a line chart to track website traffic.
Step 4: Data Customization
Once you’ve added a widget, you can customize it to display the data you want. In our case, we’re tracking daily website visitors.
Step 5: Visualization Customization
Databox offers a range of customization options for your visualization. You can choose different chart types, colors, and labels.
Step 6: Dashboard Sharing
After creating your dashboard, you can share it with team members or clients by generating a shareable link.
This brief demo showcases Databox’s ease of use and flexibility in creating customized data dashboards.
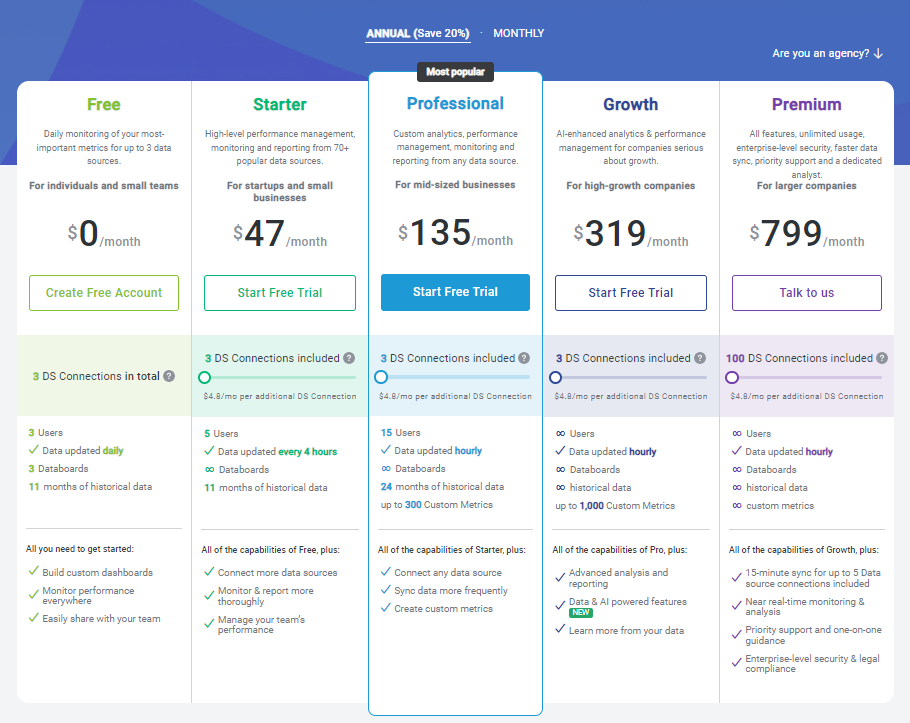
Databox Pricing
Databox offers a range of pricing plans to cater to different business needs. As of 2023, here’s an overview of their pricing structure:
1. Free Plan:
- Suitable for individuals or small teams.
- Limited data sources and dashboards.
- Basic support.
- Ideal for getting started with Databox.
2. Basic Plan:
- Starts at $49 per month.
- More data sources and dashboards.
- Priority support.
- Suitable for growing businesses.
3. Business Plan:
- Starts at $248 per month.
- Advanced features.
- Enhanced support.
- Ideal for mid-sized companies.
4. Custom Plan:
- Tailored pricing.
- Enterprise-level features.
- Dedicated support.
- Suitable for large enterprises.
It’s important to note that Databox often updates its pricing and features, so it’s advisable to visit their official website or contact their sales team for the most up-to-date information.
Conclusion
In the ever-evolving landscape of business intelligence tools, Databox shines as a user-friendly and powerful solution. Its data integration capabilities, real-time insights, customization options, and cost-effectiveness make it a valuable asset for businesses looking to harness the power of their data. With positive reviews from users and experts alike, Databox stands out as a reliable choice in the BI software market. If you’re seeking a tool to transform your data into actionable insights, Databox is certainly worth considering in 2023.
Remember, the best way to understand the true potential of Databox is to give it a try. Sign up for a demo or explore their free plan to see how it can elevate your data-driven decision-making processes. Your journey to data-driven success could start right here with Databox.